The Questions that Statistics Can't Answer
 In the past year there has been 6 democratic debates with a total of 22 candidates who have spoken 181864 words for a total of 14 hours, 47 minutes and 24 seconds.
Statistics is the science of answering questions through data. Statisticians try to be as objective as possible, by drawing conclusions solely from data, but in doing so, they often obscure the very question they are trying to answer.
In the past year there has been 6 democratic debates with a total of 22 candidates who have spoken 181864 words for a total of 14 hours, 47 minutes and 24 seconds.
Statistics is the science of answering questions through data. Statisticians try to be as objective as possible, by drawing conclusions solely from data, but in doing so, they often obscure the very question they are trying to answer.
The gender pay gap debate falls victim to this. Part of the reason why this debate is still on-going, despite the abundance of data that exists, is that statisticians can’t seem to agree on how to interpret the data.
Before going further, I’d like to say that I’m not taking a position on the gender wage gap. I just want to highlight the deficiencies in these debates and to offer a framework for thinking about statistical claims in general. Namely, that these debates make no sense without first agreeing on an underlying model of how the data is generated.
The question most sociologists are debating is this:
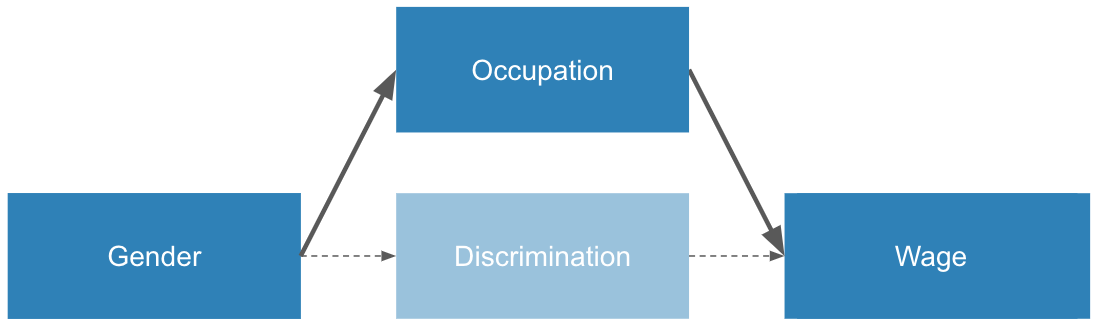
“Is gender predictive of discrimination which is predictive of a wage gap?”
Here’s an alternative view of this question:

This diagram specifies a plausible mechanism for producing data that shows a wage gap. To put it another way, this is a model of the data generation process. It specifies causal effects different factors have on each other (gender causes discrimination which causes a wage gap).
Because “discrimination” isn’t really measurable in the traditional sense, it’s unobservable, which is why I colored it lighter. Instead, to answer this question, sociologists measure the correlation between the two observable variables in this diagram, gender and wage. Doing this shows show that women on aggregate make 82% of men.
Wait… Correlation is not Causation?
The fact that there is a wage gap is indisputable, so why is this still an ongoing debate? If you recall from high school statistics: “correlation does not imply causation”.
Sociologist Jordan Peterson was confronted with this fact in an interview about the wage gap. He argued “If you’re a social scientist worth your salt, you never do a univariate analysis”. What he means is that we need to normalize for many factors before concluding that discrimination is the cause for the wage gap. One factor he mentions is occupation. Let’s think about that a bit deeper.
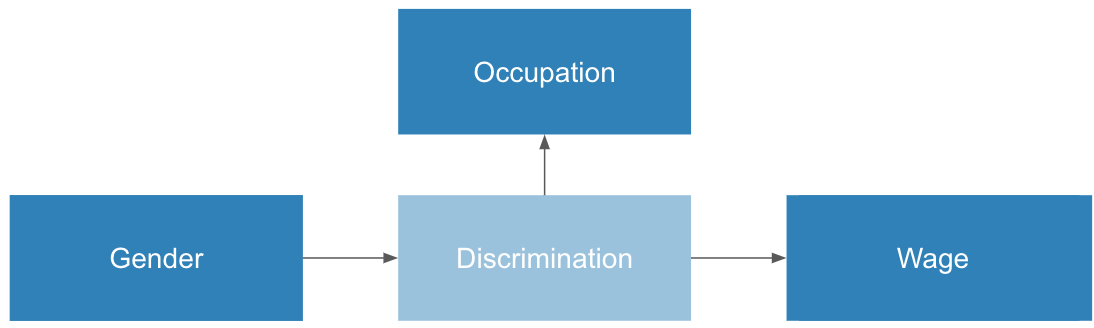
What Dr. Peterson arguing is that perhaps one of the reasons men make more than women is actually due to differences in choices of occupation between men and women. Maybe through a mechanism like this:
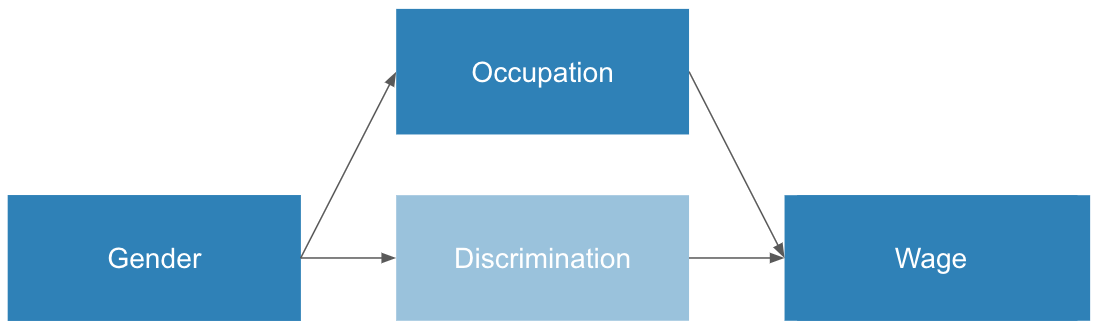
This causal diagram suggests a different mechanism than the one we saw earlier. Women tend to choose different occupations than men. These occupations are lower paying. Therefore, women make less than men. The diagram shows both discrimination and occupational choices contribute to the wage gap. In order to quantify how much discrimination contributes, Dr. Peterson argues we need to normalize for occupational choices.
If we do this, we will find that a significant amount of the wage gap “disappears” after normalizing for occupation. Dr. Peterson would perhaps argue that the world behaves more like this:
Where differences in occupational choices contributes much more to the wage gap than discrimination does.
Sidebar on Statistical Confounders
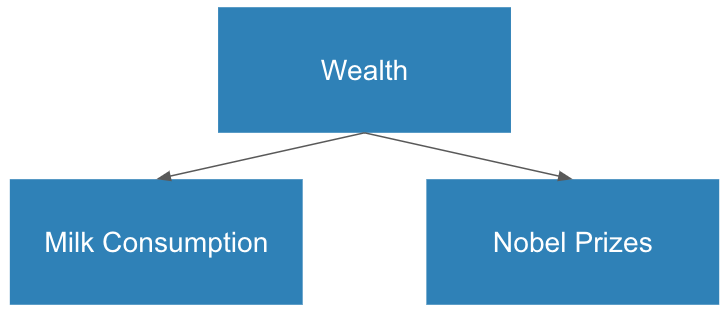
In this case, occupation is a confounder of the question we are trying to answer. It creates a correlation between two variables where no causation exists. These are found everywhere in statistics. For instance, there is a correlation between the amount of milk consumption per capita, and the number of Nobel prizes a country wins.
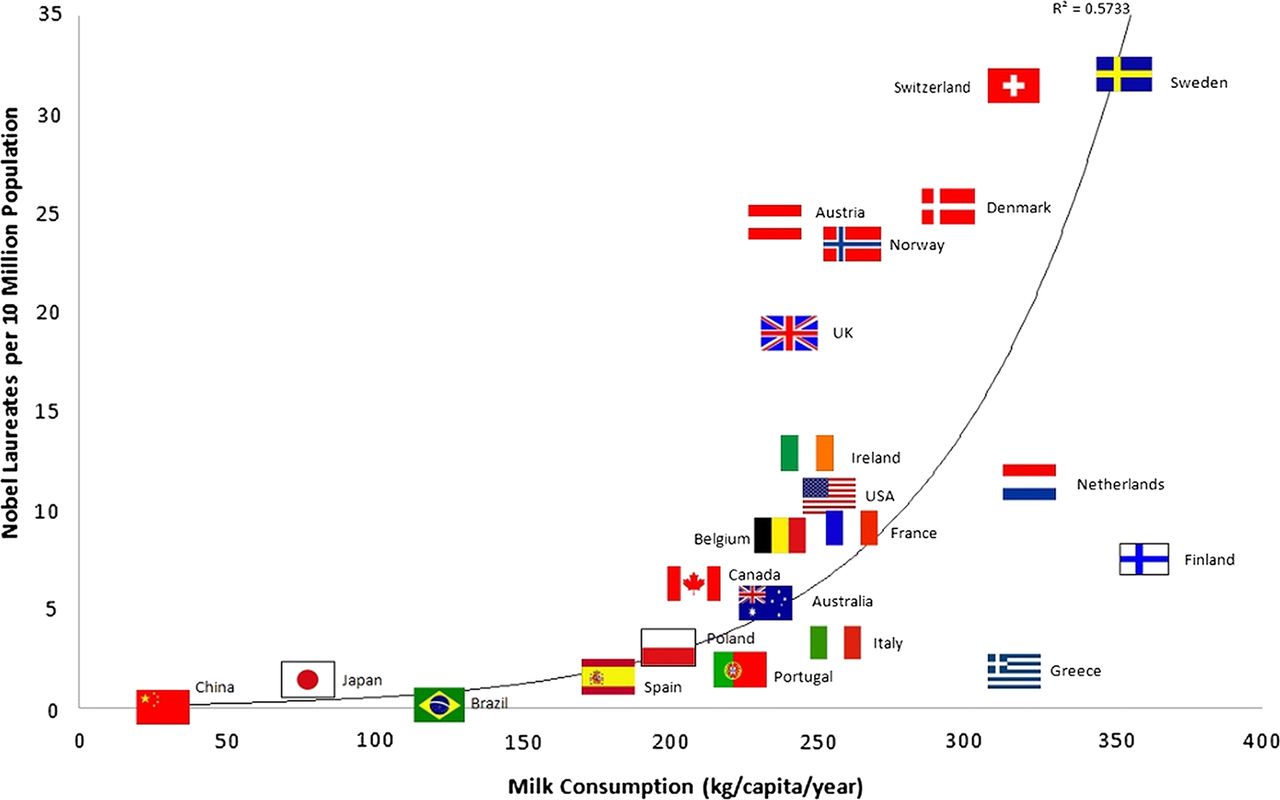
Despite this information, I doubt you’d be willing to believe that milk consumption causes Nobel prizes, because “correlation does not imply causation”
Astoundingly, some people still seem to forget this rule. Olivia B. Waxman from Time suggests that “For the U.S. (to win one additional Nobel prize), we should consume an extra 125 million kg (275.6 million lbs.) of chocolate a year.”
Indeed, this correlation is likely due to a confounder: wealth. We can see this if we plot wealth vs Nobel prizes.
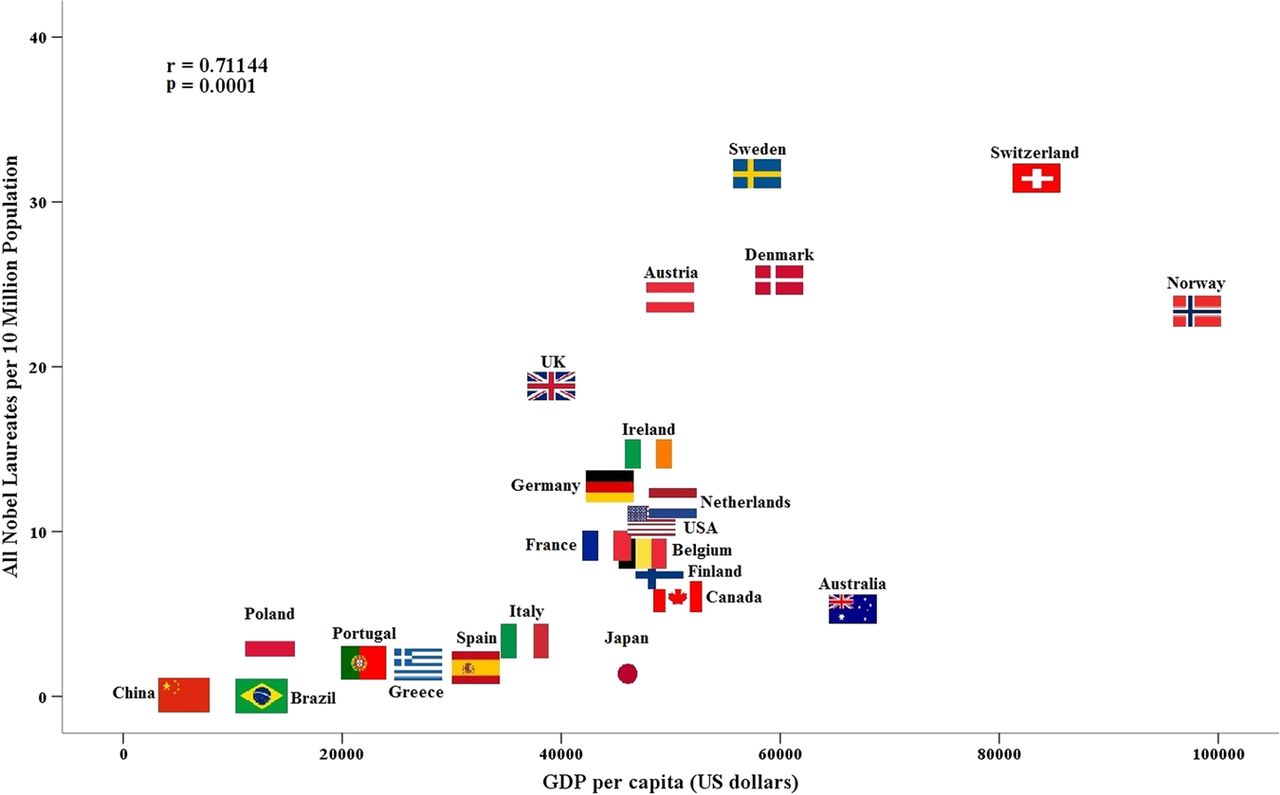
If we normalize against wealth, we would see that the correlation between Nobel prizes and chocolate becomes much weaker. (Countries that have more to spend on chocolate probably also have more to spend on education).
Dr. Peterson is essentially arguing that occupation confounds the gender vs wage correlation the same way wealth confounds the Nobel prize vs chocolate correlation.
We can apply the same remedy: normalize against occupation, which case, the correlation is shown to be weaker. Indeed, this is the cause many publications point to, to explain the wage gap.
Damn these confounding confounders
Going back to the Nobel prize vs chocolate question: When we normalized for wealth as a confounder, we implicitly assumed a causal model of the world.
But how can we be sure that “wealth” is the true cause of more Nobel prizes? Is there another confounder of this correlation? I can find one:
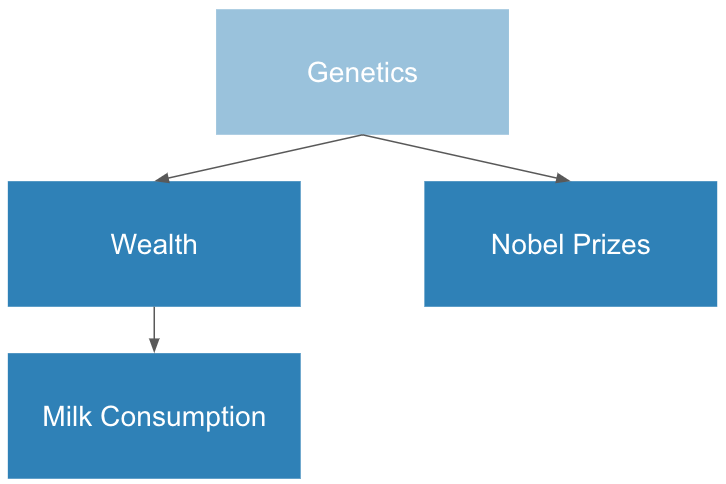
Since genetics isn’t observable, we can’t normalize for it. This causal model becomes impossible to prove or disprove. This is taking us down a weird path…
What are we normalizing for?
I hope I’ve convinced you that while data is objective, the interpretation (and therefore, utility) of data is highly subjective. Statisticians try to get around this by normalizing for every potential confounder, as a means of uncovering the true relationship between gender and wage. Age, personality, occupation, college education, marital status, etc. But, this causes other serious problems, that people often dismiss.
Let’s pull up the occupation confounder diagram again.
In this model, it makes sense to normalize against occupation, since it’s a confounder. The story this model tells is that women tend to choose different (lower paying) occupations than men do, and therefore, this explains some of the wage difference.
However, here is an alternative model of the data generation process:
This model tells a completely different story. In this model, women choose different occupations due to discriminatory pressures.
In this case, normalizing occupation removes the very mechanism through which women are underpaid due to discrimination. To put it another way, if we only look at women in high paying occupations, they would make the same as men. But women are denied access to these higher paying jobs due to discrimination. Normalizing for occupation hides the thing we were looking for in the first place.
The fundamental issue is that model 1 and model 2 can produce the exact same data, due to the fact that the “discrimination” variable is not measurable. Therefore, we don’t have the statistical tools to “prove” which model is the true data generation process.
Where to go from here?
I don’t have an answer, but I think instead of assuming that the most valid statistical study is the one that normalizes for the most factors, we could be more thoughtful about the underlying causal process that creates the data. For this wage gap question to be adequately answered, sociologists need to reach a consensus on this causal model.
If this was interesting, check out Judea Pearl’s fantastic book.